Monday, March 10, 2014
Sunday, March 9, 2014
Thursday, March 6, 2014
Monday, March 3, 2014
RCOM Chart Analysis - 28 Feb 2014
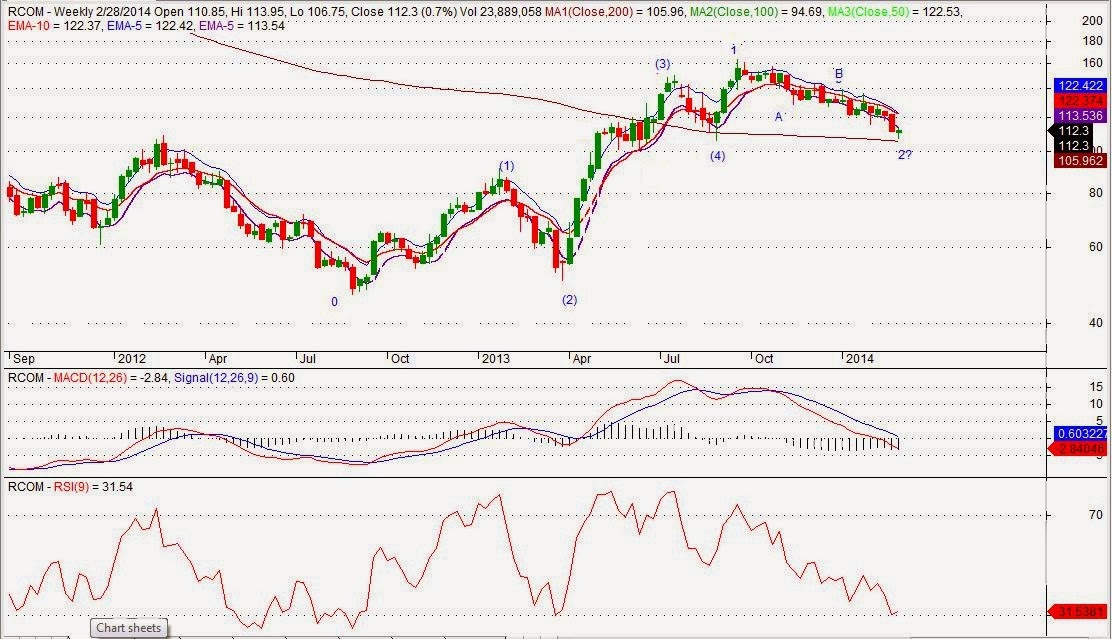
In given RCOM's weekly chart, probable EW counts is given. Probably wave 2 ended at 106.75, if not then time to come will guide us where we are heading.
Hammer pattern is formed in RCOM's week and daily time frame and hence expecting reversal and as per EW counts, may be we can expect 3rd wave to start in upside.
In given RCOM's daily chart, probable EW counts is given. Probably wave 2 ended at 106.75, if not then time to come will guide us where we are heading. Probable scenarios are given in the daily chart.
In 60 mins time-frame, +ww pattern can be observed which already triggered.
Labels:
+WW Pattern,
EW Counts,
Hammer Pattern,
Nifty & Equities,
RCOM
Thursday, February 27, 2014
TISCO Chart Analysis - 26 Feb 14
The below given chart is on Monthly Time frame and I have tried to put down EW counts on it.
The below given chart is on Weekly Time frame and I have tried to put down EW counts on it. Also, we may observe that INHS pattern is in making. Although in recent times I have noticed that this pattern didn't work as it was used to be earlier.
The below given chart is on Daily Time frame and I have tried to put down EW counts on it.
Also, we may observe that Triangle is in making in this time frame.
The below given chart is on Daily Time frame. This chart is just to show that candlestick patterns do work and if one stays with it => definitely makes profit.
The below given chart is on 15 Mins Time frame and I have tried to put down EW counts on it.
TISCO is making Gartley Pattern or already made (time will confirm on this). Levels mentioned in the chart may be used for making an entry.
Friday, February 21, 2014
Thursday, February 20, 2014
Subscribe to:
Posts (Atom)