Friday, May 23, 2014

Chart Analysis - Nifty and RCOM

Nifty - 15 mins - IHNS:
Nifty may form Inverted HNS pattern which will triggered if prices closed above 7320 in 15 mins candle.
Buy above 7320, T1 7377, T2 7433, Keeping SL at 7291 (or last swing low)


Nifty - 15 mins - EW Counts:
Nifty moved up from 7207 till 7320 in clear 5 waves. Its 50%, 61.8% and 80% retrace values are 7263, 7250 and 7229 respt.
After making high at 7319.45, nifty reversed and made low at 7259.80 in clear abc waves with a hammer in 15 mins. Its 50%, 61.8% and 80% retrace values are 7289.60, 7297 and 7307.50 respt.
1st point to identify the weeknes is prices getting resisted at 7289.60-7297. strength only above 7307.50 and will get confirmed above 7320.

RCOM:15 Mins - +WW Pattern
Buy above 137.85, T1 139.10 (done), T2 141.20, SL at 1-3-5 line (near 131.50-137.20)


RCOM- 15 mins - IHNS
RCOM may form Inverted HNS pattern which will triggered if prices closed above 142.45 in 15 mins candle.
Buy above 142.45, T1 147.80, T2 171.25, Keeping SL at 139.80 (or last swing low)


RCOM - 15 Mins - EW Counts:
Rise from 113.65 till 142.45 can be seen as in 3 clear waves. Now, 2 options are open:
1st 4th wave completed at 136 or still unfolding.
4th still running as complex correction in abc form. Below counts can be possible:
a 142.45 136 6.45 (in 3 waves)
(a) 136 141.65 6.45 (in 5 waves)
(b) 141.65 137.35 4.30 (in 3 waves)
b 137.35 xxxx (should be in 5 waves - can retrace till any %ge or beyond the start of a wave)
If we consider a=c, then b (xxxx) might end near 143.80 and then fall down to complete c in 5 waves. 
Another scenario is, 4th completed at 136 and 5th is running. This view will get negated if prices goes below 136.


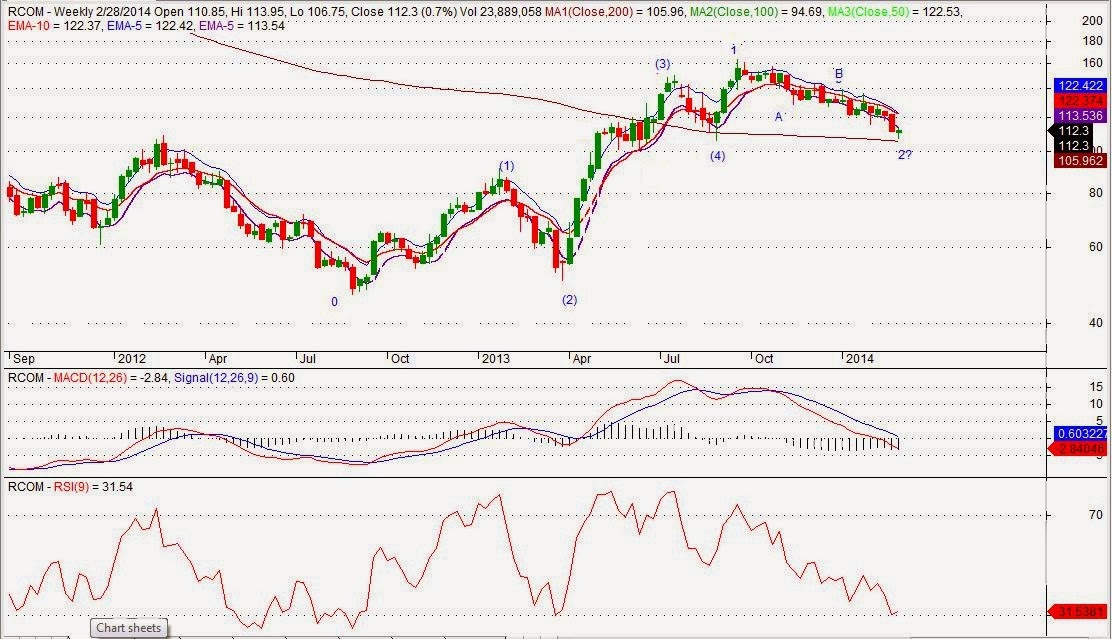
RCOM - Daily EW Counts


Wednesday, April 30, 2014

Patterns in RCOM, TataSteel, PNB, Voltas, Hindalco, IDFC

Tatasteel:
5 waves completed at 432.90 from 332 as 1st of (4) wave. Now, for wave 2, correction will be in 3 waves as ABC.
The fall from 432.90 till 404 seems to be in 5 waves. Based on 30th Apr price actions, we will come to know whether A is completed at 404 or more low is on cards.
Once, A is completed look for retrace for the fall from 432.90 till lows (as of now 404). Retrace are as below for 432.90-404:
410.82, 414.98, 418.45, 421.86, 425.27, 427.12

Pattern may form: HNS
After forming 'Rising Wedge' pattern and hitting its targets (417.35 and then 405), TS may form HNS pattern.
Neckline: 404.75 - 404; Shoulders - 416.75 - xxxx (should restrict the upmove around 416 where there is clustor resistence
If restricted at 416 (aprx), then look for below targets on downside after breaking of 404:
Breakdown below 404, Tgt 1 = 392; Tgt 2 - 375.10, keeping SL at 410.


RCOM:
Breakout above 135.40, tgt 1- 139.90. tgt 2 - 147.25. SL 133.10
Breadown below 131.25, tgt 1 - 126.75, tgt 2 - 119.40, SL 133.50


Voltas:
Rising wedge in daily charts:
Breakdown below: 163.30, Tgt 1 - 157.70 (Done), Tgt 2 - 144.45, SL - 167.10


IDFC:
The prices are correcting in a channel for the rise till 139.
In this correction, falls are in 5 waves and rise are in 3 waves. If we observe the recent rise, is in 3 waves.
Hence, expecting the fall from 116.40 till channel support (should come near to 104) will be in 5 waves.
From 116.40 till 113.65, 1st sub wave might have done. Around 115 - 115.85, 2nd sub wave may get complete.
Short between 115-115.85, keeping SL at 116.40 for the target neat to 104.


Hindalco:
Rising wedge in daily charts:
Breakdown below: 136.30, Tgt 1 - 131.15, Tgt 2 - 122.80, SL - 138.90


PNB:
Rising wedge in daily charts:
Breakdown below: 780, Tgt 1 - 753.80, Tgt 2 - 711.40, SL - 791.10


Tuesday, April 29, 2014

Patterns in RCOM, TataSteel, PNB and Voltas

RCOM: 
Triangle can be observed in RCOM Daily chart
Breakout above 135.40, tgt 1- 139.90. tgt 2 - 147.25. SL 133.10
Breakdown below 131.25, tgt 1 - 126.75, tgt 2 - 119.40, SL 133.50


TataSteel (Daily Chart):
Rising Wedge, Breakdown below 425 (in 1 hr chart), tgt 1 - 417.35, tgt 2 - 405, SL 428.85


TataSteel (Weekly Chart):
INHS Pattern in making which has breakout above 432 (on weekly close basis).
Tgt 1 - 535.50, Tgt 2 - 672.20 keeping SL at 380 after break out


Voltas:
Rising wedge in daily charts.
Breakdown below: 163.30, Tgt 1 - 157.70, Tgt 2 - 144.45, SL - 167.10


PNB:
Rising wedge in daily charts.
Breakdown below: 778, Tgt 1 - 751.80, Tgt 2 - 709.40, SL - 791.10


Monday, April 28, 2014

RCOM Chart for 28 Apr 2014

Two Patterns are in making in 60 mins chart.
1. Triangle:
Breakout above 136, tgt 1- 140.60. tgt 2 - 148. SL 133.70
Breadown below 131, tgt 1 - 126.40, tgt 2 - 119, SL 128.70

2. Bull Flag: BO above 134.40, tgt 1- 137.55, tgt 2 - 141.15, SL 132.60


Wednesday, April 16, 2014

Thursday, April 10, 2014

RCOM Updates - 9 Apr 2014

On 7 Apr, RCOM closed above its 200DMA (131.90) with volume and on 9 Apr, prices even didn't touch it.

Preferred EW Counts (as per my limited knowledge): 
Wave 3 is subdividing and (iv) might have completed at 126.35 (fall from 133.80 to 126.35 was in clear 3 waves). Rise from 126.35 to 133 (in 5 waves) to complete i of (v) and then fall from 133 to 126.55 (in 3 waves) to complete ii of (v). iii completed at 136.40 and iv at 134.10 and now v of (v) might be unfolding.

Alt Count: Wave 3 is subdividing and (iv) might have completed at 126.55.

If we observe wave (i) and (iii), both seems to be normal, so we can expect (v) wave to extend to complete 3.
At 142.50 (61.8% of the fall from 164.65 to 106.75), 3 wave may end and thereon correction starts as wave 4 for the rise from 112.75 to the high made be wave 3

Bull Flag Pattern:
Bull flag can be observed in RCOM's hour chart.
BO above: 136.40, T1= 138.50; T2 = 144.90 keeping SL at 135.35 post break out.

Tuesday, April 8, 2014

RCOM Closed above 200DMA - Need Follow Up?

On 7 Apr, RCOM closed above its 200DMA (131.90) with volume and needs follow up action on 9th. 
EW Counts (as per my limited knowledge): 
Option 1 - Wave 3 is subdividing and (iv) might have completed at 126.55.
Option 2 - Wave 3 is subdividing and (iv) might have completed at 126.35 (fall from 133.80 to 126.35 was in clear 3 waves). Rise from 126.35 to 133 (in 5 waves) to complete i of (v) and then fall from 133 to 126.55 (in 3 waves) to complete ii of (v). Currently iii of (v) is unfolding fro 126.55. 
If we observe wave (i) and (iii), both seems to be normal, so we can expect (v) wave to extend to complete 3.
At 142.50 (61.8% of the fall from 164.65 to 106.75), 3 wave may end and thereon correction starts as wave 4 for the rise from 112.75 to the high made be wave 3

Thursday, March 6, 2014

RCOM Chart Analysis - 5 March 2014


4th March Analysis:
As on 6th March, Gartley pattern seems invalidated,

Monday, March 3, 2014

RCOM Chart Analysis - 28 Feb 2014


In given RCOM's weekly chart, probable EW counts is given. Probably wave 2 ended at 106.75, if not then time to come will guide us where we are heading.


Hammer pattern is formed in RCOM's week and daily time frame and hence expecting reversal and as per EW counts, may be we can expect 3rd wave to start in upside.


In given RCOM's daily chart, probable EW counts is given. Probably wave 2 ended at 106.75, if not then time to come will guide us where we are heading. Probable scenarios are given in the daily chart.


In 60 mins time-frame, +ww pattern can be observed which already triggered.