Monday, March 3, 2014

RCOM Chart Analysis - 28 Feb 2014


In given RCOM's weekly chart, probable EW counts is given. Probably wave 2 ended at 106.75, if not then time to come will guide us where we are heading.


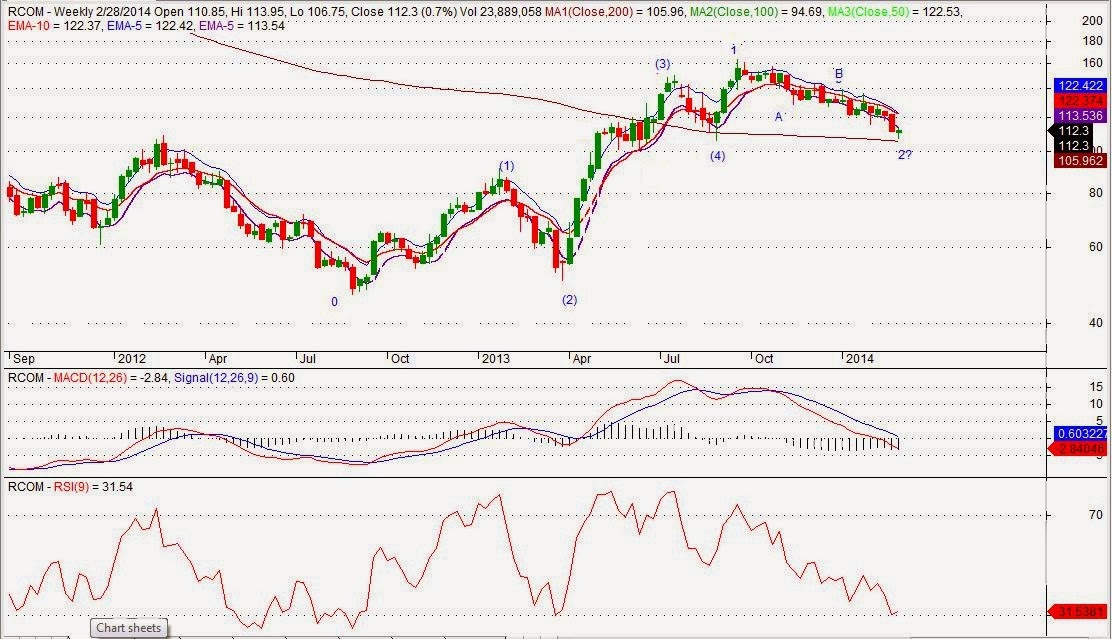
Hammer pattern is formed in RCOM's week and daily time frame and hence expecting reversal and as per EW counts, may be we can expect 3rd wave to start in upside.


In given RCOM's daily chart, probable EW counts is given. Probably wave 2 ended at 106.75, if not then time to come will guide us where we are heading. Probable scenarios are given in the daily chart.


In 60 mins time-frame, +ww pattern can be observed which already triggered.


Thursday, February 27, 2014

TISCO Chart Analysis - 26 Feb 14


The below given chart is on Monthly Time frame and I have tried to put down EW counts on it.


The below given chart is on Weekly Time frame and I have tried to put down EW counts on it. Also, we may observe that INHS pattern is in making. Although in recent times I have noticed that this pattern didn't work as it was used to be earlier.


The below given chart is on Daily Time frame and I have tried to put down EW counts on it. 
Also, we may observe that Triangle is in making in this time frame.


The below given chart is on Daily Time frame. This chart is just to show that candlestick patterns do work and if one stays with it => definitely makes profit.


The below given chart is on 15 Mins Time frame and I have tried to put down EW counts on it.


TISCO is making Gartley Pattern or already made (time will confirm on this). Levels mentioned in the chart may be used for making an entry.


Friday, February 7, 2014

IFCI Chart Analysis - 6Feb14

In 60 Mins TF - IFCI is trading in channel. Expect breakout above 23 or breakdown below 22.1-22.2 for the target points of 0.9 in the direction of break.

In below chart, if we observe below may be resistance and supports in 60min TF
Resistences - 23.3-23.4, then 23.8
Supports - 22.4, then 21.8

In below chart, if we observe below may be resistance and supports in Daily TF
1st restence - 22.9
2nd resistence - 23.6
1st support - 21.5
2nd Suport - 21.2
In Weekly TF, weekly hammer is in making. A close on friday between 22.4-23.37 will validate this
pattern.


Nifty Update - 6 Feb 14

60Mins TF - Nifty is moving up in a channel making higher highs and lower lows in last three sessions. Bear made 3 unsuccessful attempt to close Nifty below 200DMA. Looking at the channel, there may be breakout above 6048 or breakdown below 6000-5990.
If breakout above 6048, then T1 - 6070, T2-6118, SL 6036
If breadown below 6000, then T1 - 5978, T2-6030, SL 6012


Week TF - Weekly hammer is in making. A close on Friday between 6071-6117 will validate this pattern.


Wednesday, January 22, 2014

BHARTIARTL Chart Analysis - 22 Jan 14

In below 15 Mins TF, IHNS pattern can be observed in BHARTIARTL (in 30/60 Min as well).
Pattern Breakout: Price breaks neckline (currently at 311.50) on the upside.
Pattern BO Tgt: 319-320 with SL below 307.85

In below 15 Mins TF, Bull Flag pattern can be observed in BHARTIARTL.
Pattern Breakout: Above 310.22 (currently).
Pattern BO Tgt 1: 312.5 and Tgt 2: 319 with SL below 309


BHARTIARTL made Bullish Harami Pattern today in Daily chart which is very bullish in nature but need confirmation on 3rd day.


BHARTIARTL is re-testing up-trendline (joining 238.45-275.2-280.5). This is currently placed at 302.65 which is also the recent low made by BHARTIARTL


In weekly time frame,:
1. Weekly Hammer is in making and will get confirmation on 24th Jan's closing price
2. Weekly up-trendline may provide support to BHARTIARTL which is currently at 307.5
3. We can spot Triangle in weekly chart with breakdown below 307.5 based on weekly closing price (i.e. on 24 Jan)