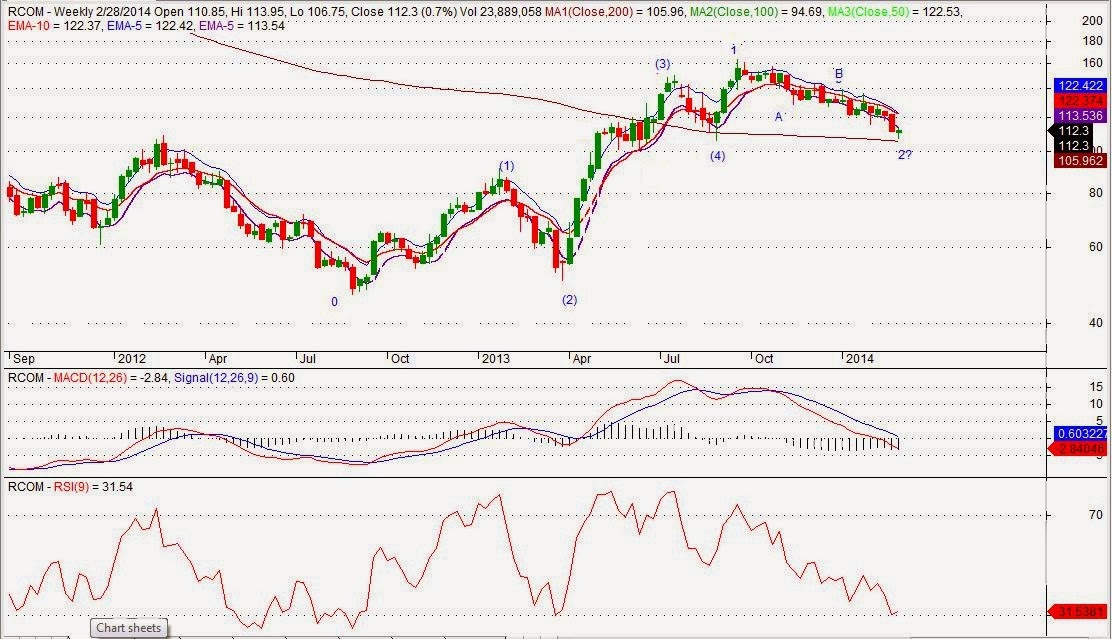
In given RCOM's weekly chart, probable EW counts is given. Probably wave 2 ended at 106.75, if not then time to come will guide us where we are heading.
Hammer pattern is formed in RCOM's week and daily time frame and hence expecting reversal and as per EW counts, may be we can expect 3rd wave to start in upside.
In given RCOM's daily chart, probable EW counts is given. Probably wave 2 ended at 106.75, if not then time to come will guide us where we are heading. Probable scenarios are given in the daily chart.
In 60 mins time-frame, +ww pattern can be observed which already triggered.


Dear Prabhanshu Raman
ReplyDeleteGreetings to you.
Can you share short term as well as long term labeling of BIOCON.
Your Tatasteel post was very impressive and hence this request to you.
I am slowly trying to learn EW.
Hope you oblige when you find time
Thanks
Kannan
Thanks Kannan. Sure will try to do that.
ReplyDelete